Business cycle
The Business Cycle Tracer is a graphical method used for presentation of the economic and industrial state. The business cycle is based on the tendency survey of the businesses of manufacturing, construction, service and retail trade, conducted by Statistics Denmark.
Contrary to a traditional graphical representation of the economic cycle on a timeline (see the tendency survey for the manufacturing industry)
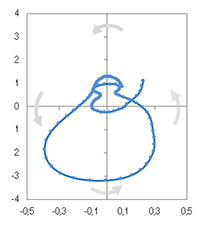 The data in a business cycle have been traced in a system of coordinates defined by the four economic stages; increase above trend, decrease above trend, decrease below trend and increase below trend. The four stages are also called; boom, downswing, recession and upswing, but these terms are normally used in a wider connection including more indicators e.g. BNP and unemployment.
The value of the market trends, which is indicated by the vertical y-axis, is a compound economic indicator similar to Confidence indicators of the tendency surveys for the manufacturing, construction, service and retail trade. Here it is calculated using a statistical method, principal component-analysis, which focuses on the total information of the original basic indicators. The horizontal x-axis indicates the change in the value of the market trends by month and can be interpreted as the speed of the market trend development.
The visual course enables one to compare a current economic cycle with earlier economic cycles, in regard to how fast the change occurs and the size of the fluctuations compared to underlying trends. The course is subject to a certain degree of uncertainty especially when looking at the latest month’s development, which is continuously revised, but overall, the results are sturdy.
The economic cycle is a graphical presentation of the market trend development created by a method similar to what is used by the EU commission (DG ECFIN). The interactive presentation tool has been provided by Statistics Netherlands.
Documentation of statistics
Get an overview of the purpose, content and quality of the statistics. Here you can find information on the sources that the statistics are derived from, what the statistics contains and how often it is published.
Business Cycle Tracer by industry
Get your own statistics in the Statbank about Business Cycle Tracer (KONCYK1)
Guidance
All graphs start in 2008 and with dark color from 2015 onwards.
The y-axis indicates the business cycle value, and the x-axis indicates the change in the business cycle value from month to month.
The red dots mark January for each year.
The black dots indicate the most recent month.
Colored dots indicate other months.
Related content in Business cycle
Contact
Didn’t find what you were looking for?
Do you need help finding the right statistics?
Contact our Information Service
Do you need customised statistics, help with interview surveys, or do you, as a researcher, want access to microdata? Then you are in the right place.
Read about our products and services