
Producer price index for services
What is the trend in producer sales prices for services? How have prices developed for freight transport by road, legal activities, and information services? The producer price index for services measures the price trend of services at the first level of trade in domestic and export markets. The index is used as an economic indicator and a deflator to adjust service items for inflation in the constant price calculations of the national accounts.
Explainer on…
The sales price of products at the first stage of distribution, which typically involves the sale of goods from the producer to other businesses. In the Producer Price Index, the relevant price is the basic price, which excludes VAT and other deductible taxes related to turnover. Taxes and duties on goods and services invoiced by the company, are also excluded, whereas any product-related subsidies and discounts are included.
Selected statistics on Producer price index for services
Price development for selected industries
Producer Price Index for Services is calculated on the basis of price reports directly from selected service producing companies. The sample consists of ca. 2.300 prices divided into a number of industry groups set out by the European Regulation that the statistic follows. Within each industry group, the largest companies are selected, based on turnover value (top-down) to achieve as high an industry turnover coverage as possible. By selecting the largest companies within a given product group, it is assumed that as per basic market theory these larger companies, as price influencers, have both a large direct share of transactions but also an even larger indirect representativeness which helps to ensure a representative sample for the entire product group. Each of these companies is requested to select their most representative service(s), i.e. those products that most represent their sales within a given product group. Since there is a big difference between the industries, they are treated independently with their own sample selection.
Each selected company is determined by their legal entity registration. In Denmark's Statistics Business Statistical Register, the legal entities are determined by their CVR number. In cases where a company has multiple CVR numbers sharing the same activity these can be combined into one unit from which prices are collected, for example, franchises. The companies must, as far as possible, report the average price for the quarter, if that is unavailable they must report the price in force on the 15th of the mid-month of the quarter. For industries or products with high variation within the quarter – an average price for the whole month is always preferred.
Weights for aggregation purposes come from the National Accounts product balances, based on several internal primary sources (industrial commodity statistics, account statistics and foreign trade statistics). This covers the main part of all trading in the first turnover stage in Denmark, within the delimitation of the purpose of the statistics. The weights used are implemented with a lag of 3 years.
Producer price index for services
| Index | Percentage change compared to previous quarter | Percentage change compared to same quarter the year before | |
|---|---|---|---|
| 2026Q2 | |||
| 49.4 Freight transport by road and removal services | 131.1 | 1.5 | 3.8 |
| 49.41 Freight transport by road | 131.1 | 1.5 | 3.7 |
| 49.42 Removal services | 131.5 | 0.0 | 4.9 |
| Sum of (50.1 and 50.2) Sea and coastal water transport | .. | .. | .. |
| 51 Air transport | .. | .. | .. |
| 51.1 Passenger air transport | .. | .. | .. |
| 51.2 Freight air transport and space transport | .. | .. | .. |
| 52 Warehousing and support activities for transportation | 120.1 | -0.3 | -2.4 |
| 52.1 Warehousing and storage | 124.5 | 0.2 | 4.1 |
| 52.2 Support activities for transportation | 119.4 | -0.4 | -3.2 |
| 52.21 Service activities incidental to land transportation | 111.0 | 3.9 | 2.0 |
| 52.22 Service activities incidental to water transportation | .. | .. | .. |
| 52.23 Service activities incidental to air transportation | .. | .. | .. |
| 52.24 Cargo handling | 135.5 | -1.0 | 6.9 |
| 52.29 Other transportation support activities | 115.0 | -2.8 | -7.9 |
| 53 Postal and Courier activities | .. | .. | .. |
| 53.1 Postal activities under universal service obligation | .. | .. | .. |
| 53.2 Other postal and courier activities | 116.6 | 1.3 | 1.2 |
| 61 Telecommunications | .. | .. | .. |
| 62 Computer programming, consultancy and related activities | 109.5 | 0.8 | -0.3 |
| 63 Information service activities | 109.9 | -0.1 | 2.4 |
| 68 Real estate activities | .. | .. | .. |
| 68.2 Rental and operating of own or leased real estate | 114.3 | 0.3 | 1.7 |
| 68.31 Real estate agencies | .. | .. | .. |
| 68.32 Management of real estate on a fee or contract basis | 114.5 | 0.9 | 2.2 |
| 69 Legal and accounting activities | 121.4 | -0.1 | 0.2 |
| 69.1 Legal activities | 116.0 | 0.4 | 3.3 |
| 69.2 Accounting, bookkeeping and auditing activities; tax consultancy | 125.7 | -0.3 | -1.9 |
| Sum (69 og 70.22) Legal activities etc. | 115.6 | 0.1 | -0.2 |
| 70.22 Business and other management consultancy activities | 108.0 | 0.4 | -0.7 |
| 71 Architectural and engineering activities | 113.2 | 1.6 | 3.2 |
| 71.1 Architectural activities | 118.4 | 4.0 | 4.3 |
| 71.2 Engineering activities and related technical consultancy | 112.0 | 1.4 | 3.0 |
| 71.2 Technical testing and analysis | 117.2 | 0.9 | 2.4 |
| 73 Advertising and market research | 106.9 | 0.8 | 0.8 |
| 78 Employment activities | 117.4 | 0.9 | -0.6 |
| 80 Security and investigation activities | 124.9 | 1.8 | 3.2 |
| 81.2 Cleaning activities | 117.1 | 0.8 | 3.5 |

Producer Price Index for Services is calculated on the basis of price reports directly from selected service producing companies. The sample consists of ca. 2.300 prices divided into a number of industry groups set out by the European Regulation that the statistic follows. Within each industry group, the largest companies are selected, based on turnover value (top-down) to achieve as high an industry turnover coverage as possible. By selecting the largest companies within a given product group, it is assumed that as per basic market theory these larger companies, as price influencers, have both a large direct share of transactions but also an even larger indirect representativeness which helps to ensure a representative sample for the entire product group. Each of these companies is requested to select their most representative service(s), i.e. those products that most represent their sales within a given product group. Since there is a big difference between the industries, they are treated independently with their own sample selection.
Each selected company is determined by their legal entity registration. In Denmark's Statistics Business Statistical Register, the legal entities are determined by their CVR number. In cases where a company has multiple CVR numbers sharing the same activity these can be combined into one unit from which prices are collected, for example, franchises. The companies must, as far as possible, report the average price for the quarter, if that is unavailable they must report the price in force on the 15th of the mid-month of the quarter. For industries or products with high variation within the quarter – an average price for the whole month is always preferred.
Weights for aggregation purposes come from the National Accounts product balances, based on several internal primary sources (industrial commodity statistics, account statistics and foreign trade statistics). This covers the main part of all trading in the first turnover stage in Denmark, within the delimitation of the purpose of the statistics. The weights used are implemented with a lag of 3 years.
Calculating the change in percentage
How to calculate the percentage change between two periods using index values.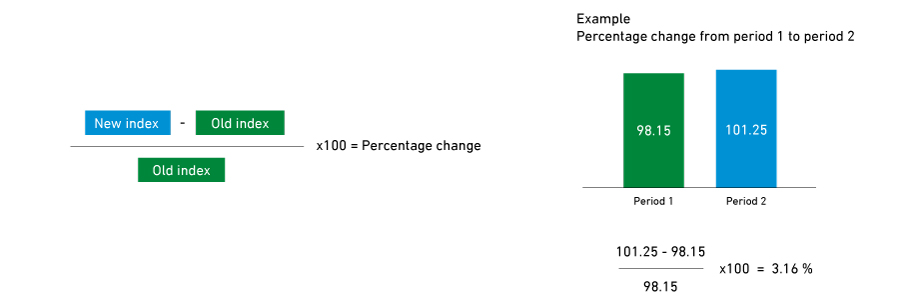
Calculating percentage change from year to year (instead of month to month)? Use table PRIS02

On the statistics – documentation, sources and method
See the documentation of statistics to learn more:
The statistics Producer and Import Price Index for Commodities show the price development of commodities in the first stage of transaction. The primary use is as deflators (converting nominal values to real values), but is also used as a business cycle indicator and for contract adjustments in the business sector. The index can be divided into Producer price index for commodities, Import price index for commodities and Price index for domestic commodities supply. The Price index for domestic supply of commodities can be traced back to 1876 and in the current form back to 1981. Producer Price Index for Commodities dates back to 2000 and Import Price Index for Commodities to 2005.
The purpose of these statistics, is to analyze price trends in the first stage of commercial transaction of services, i.e. producers' selling prices to other producers (business to business), ex VAT. These statistics have been compiled since 2006.