All the previous sections have highlighted the role the wage equation plays in ADAM in achieving stability after the economy have been displaced from equilibrium. We can now introduce shock to the wage equation itself. Table 17 presents the effect of a temporary 1 per cent increase in wages. (See experiment)
Table 17. The effect of a temporary increase in wage
| 1. yr | 2. yr | 3. yr | 4. yr | 5. yr | 10. yr | 15. yr | 20. yr | 25. yr | 30. yr | ||
| Million 2005-kr. | |||||||||||
| Priv. consumption | fCp | 594 | -299 | 590 | 1208 | 1616 | 2129 | 1459 | 567 | -184 | -659 |
| Pub. consumption | fCo | 18 | 29 | 30 | 24 | 21 | 15 | 13 | 8 | 0 | -8 |
| Investment | fI | -309 | -968 | -1022 | -456 | -65 | 487 | 215 | -157 | -341 | -329 |
| Export | fE | -1973 | -2431 | -2809 | -3127 | -3383 | -3645 | -2993 | -1910 | -733 | 253 |
| Import | fM | -311 | -1102 | -865 | -462 | -268 | -235 | -496 | -597 | -490 | -264 |
| GDP | fY | -1298 | -2452 | -2168 | -1692 | -1336 | -564 | -592 | -671 | -542 | -254 |
| 1000 Persons | |||||||||||
| Employment | Q | -2.03 | -3.92 | -4.52 | -4.50 | -4.28 | -3.00 | -2.42 | -1.90 | -1.16 | -0.38 |
| Unemployment | Ul | 1.21 | 2.26 | 2.53 | 2.49 | 2.36 | 1.66 | 1.34 | 1.05 | 0.64 | 0.21 |
| Percent of GDP | |||||||||||
| Pub. budget balance | Tfn_o/Y | 0.08 | 0.02 | -0.18 | -0.15 | -0.13 | -0.08 | -0.07 | -0.08 | -0.08 | -0.07 |
| Priv. saving surplus | Tfn_hc/Y | -0.07 | 0.02 | 0.18 | 0.11 | 0.06 | -0.05 | -0.04 | -0.01 | 0.01 | 0.02 |
| Balance of payments | Enl/Y | 0.02 | 0.04 | 0.00 | -0.04 | -0.07 | -0.12 | -0.11 | -0.09 | -0.07 | -0.05 |
| Foreign receivables | Wnnb_e/Y | -0.28 | -0.22 | -0.21 | -0.27 | -0.33 | -0.77 | -1.16 | -1.41 | -1.54 | -1.56 |
| Bond debt | Wbd_os_z/Y | -0.24 | -0.22 | -0.04 | 0.11 | 0.23 | 0.65 | 0.92 | 1.15 | 1.33 | 1.42 |
| Percent | |||||||||||
| Capital intensity | fKn/fX | 0.12 | 0.18 | 0.15 | 0.13 | 0.11 | 0.10 | 0.11 | 0.09 | 0.05 | 0.00 |
| Labour intensity | hq/fX | 0.05 | 0.05 | 0.02 | 0.00 | -0.01 | -0.01 | -0.01 | -0.01 | -0.01 | -0.01 |
| User cost | uim | 0.33 | 0.32 | 0.30 | 0.28 | 0.27 | 0.19 | 0.12 | 0.05 | -0.01 | -0.03 |
| Wage | lna | 1.14 | 1.05 | 0.95 | 0.88 | 0.81 | 0.50 | 0.27 | 0.07 | -0.07 | -0.14 |
| Consumption price | pcp | 0.34 | 0.35 | 0.34 | 0.33 | 0.33 | 0.26 | 0.18 | 0.09 | 0.02 | -0.03 |
| Terms of trade | bpe | 0.25 | 0.24 | 0.22 | 0.21 | 0.20 | 0.14 | 0.09 | 0.03 | -0.01 | -0.03 |
| Percentage-point | |||||||||||
| Consumption ratio | bcp | 0.07 | 0.02 | -0.12 | -0.07 | -0.02 | 0.07 | 0.07 | 0.04 | 0.01 | -0.01 |
| Wage ratio | byw | 0.30 | 0.27 | 0.21 | 0.16 | 0.13 | 0.05 | 0.00 | -0.03 | -0.04 | -0.04 |
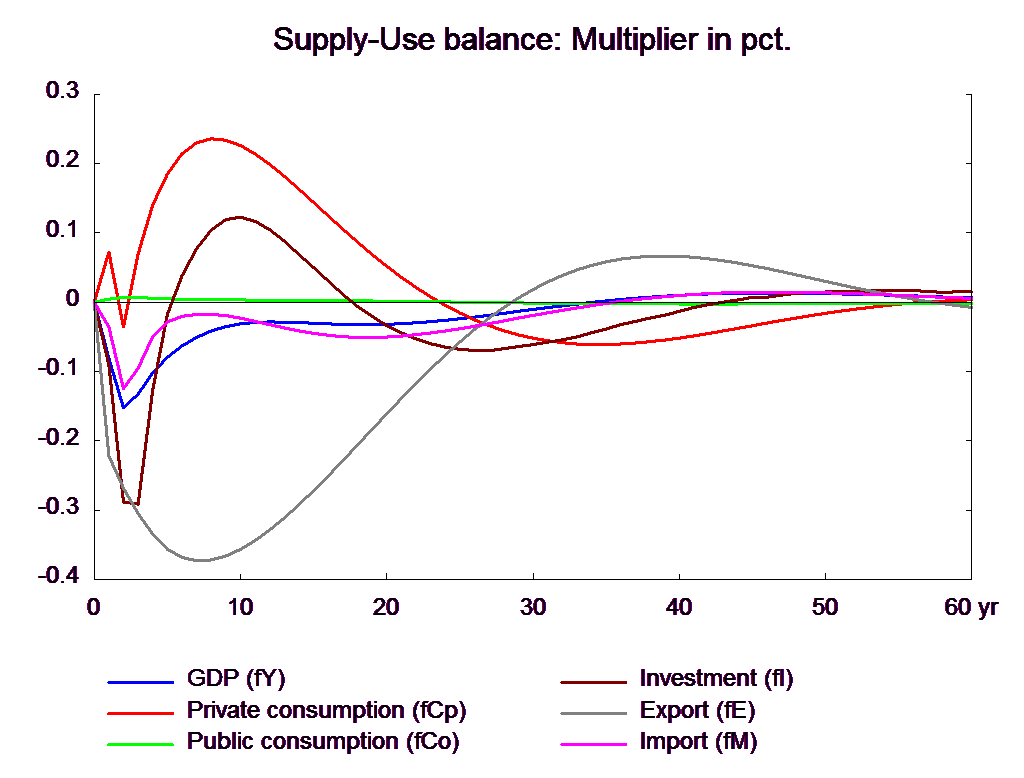
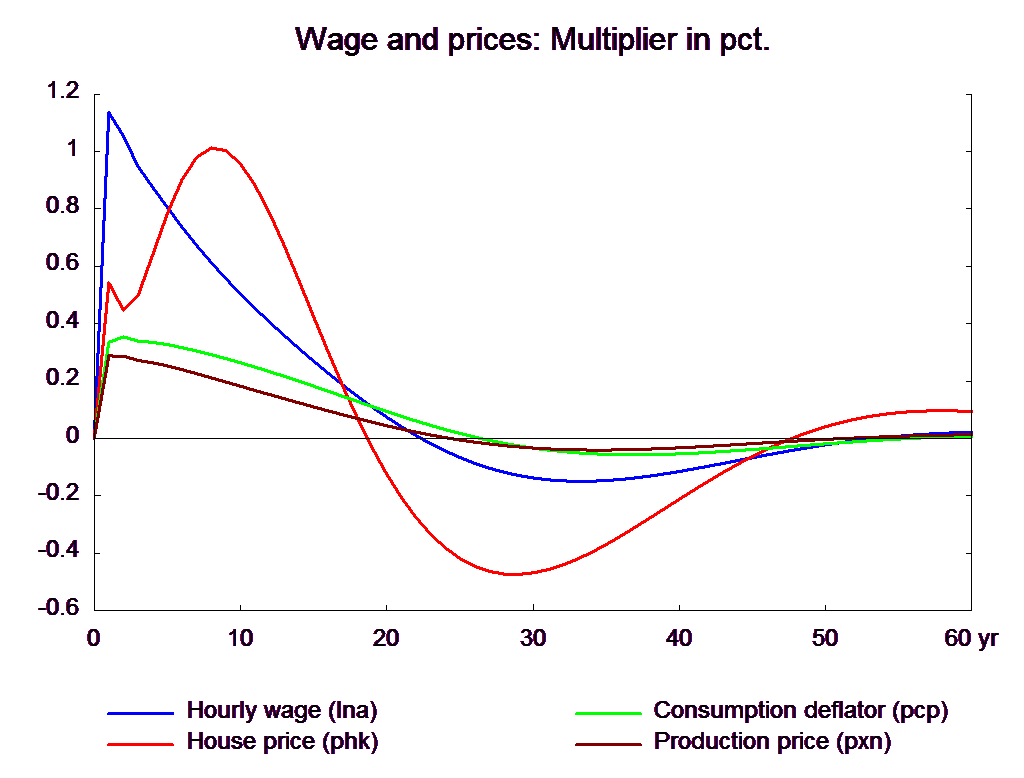
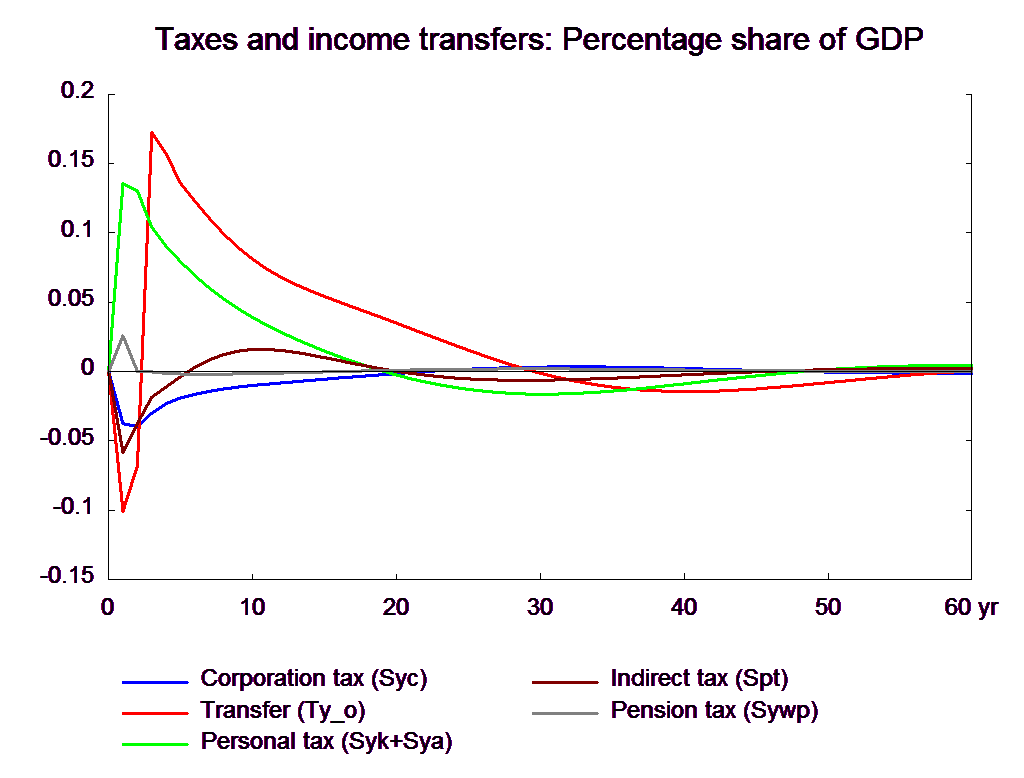
The higher wage has both a positive and negative effect on the economy. The former is due to the positive effect on domestic demand. Wages increase more than consumption prices, as the latter include import prices that are exogenous. And this raises real wage and private consumption increases. Two years after the wage increase, income transfers from the government increase, because the equation for the rate of income transfers depends on wages with a lag of two years. This worsens public finance and raises disposable income and consumption.
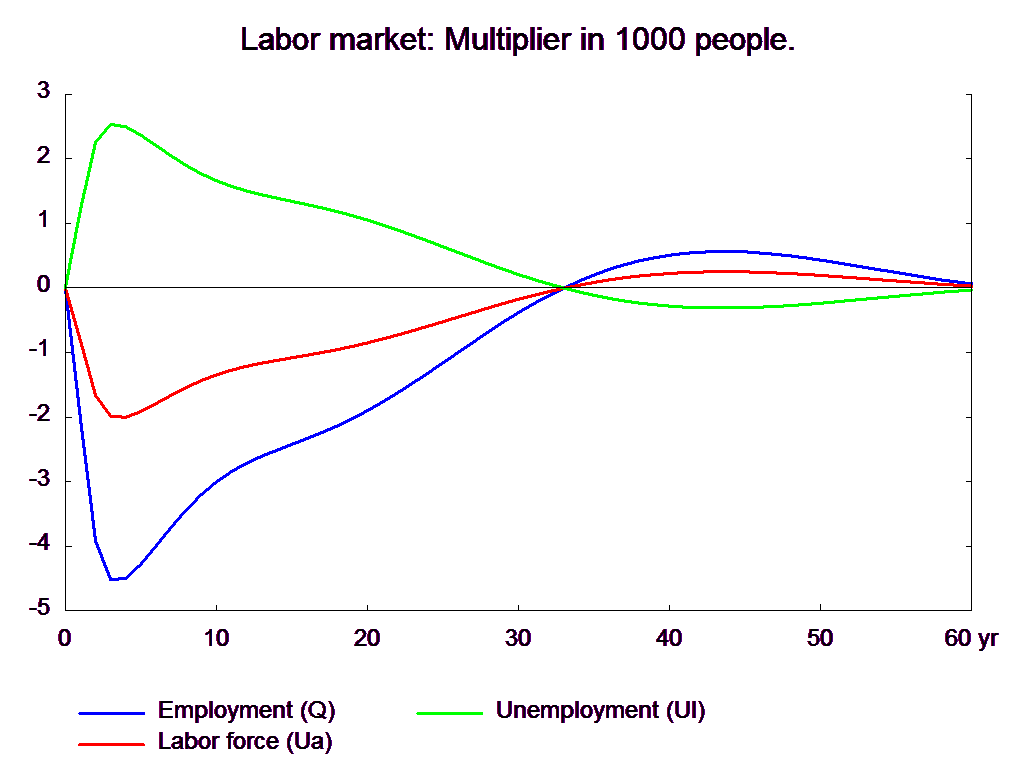
The negative effect arises due to a negative effect on foreign demand. The higher wage raises prices and worsens competitiveness. This leads to a fall in net exports. Consequently, production and employment fall. The lower production also drags investments down. In the short run, the negative effect is stronger and unemployment increases, i.e. wage increase creates an economic downturn.
In the long run, the higher unemployment reduces wage and price growths, and exports recover as competitiveness starts to improves. Investments rise due to the substitution of capital for labor. Over time, the effect on employment disappears and wages return to the baseline. In the long run, all variables return to the baseline except for a permanent negative impact on public and foreign debt, reflecting the accumulated budget impact in the transition period before the equilibrium is reestablished.
Figure 17. The effect of a temporary increase in wage