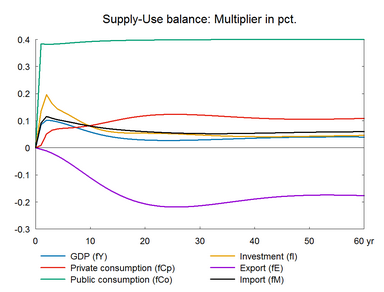
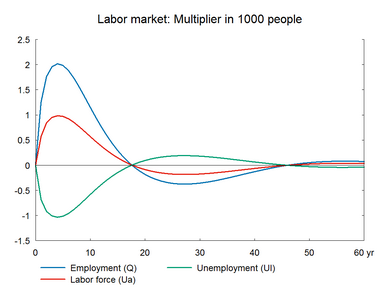
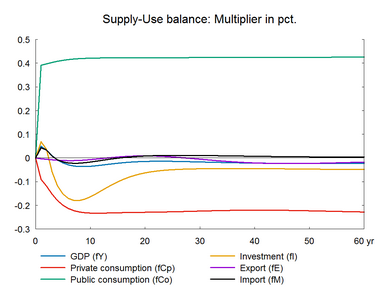
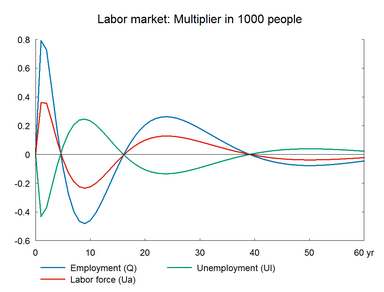
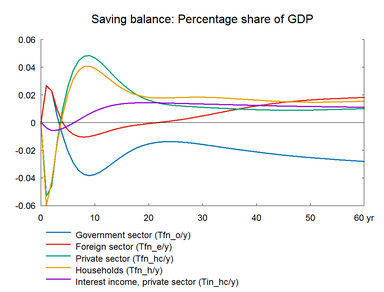
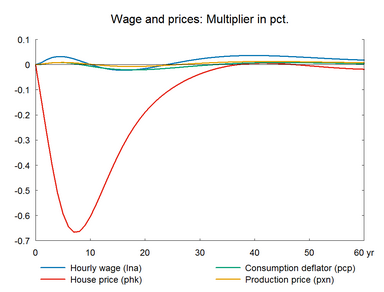
Expansion in public expenditure creates higher demand for private output, which leads to expansion in private sector production and employment in the short run. In the long run, there is no effect on private-sector employment.
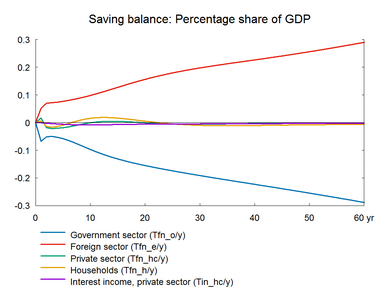
The consumption equation stabilizes and returns the saving surplus of the private sector to the baseline. However, because of the absence of fiscal reaction function, the public saving deteriorates permanently. If the higher public consumption is financed by higher taxes, there will be no effect on public budget in the long run. In the following, two scenarios are presented: in the first case the public purchase is not financed and in the second case the additional public purchase is financed by higher income taxes.
Public expenditure is increased permanently by 0.1 percent of GDP relative to the baseline in 2010 prices.(See experiment)
Table 1a. The effect of a permanent increase in general government spending
The immediate effect of an increase in government purchase of goods and services is that total demand rises. The increased demand is met partly through domestic production and partly through imports. The expansion in domestic economic activity raises private sector employment and lowers unemployment. The lower unemployment rate pushes prices and wages upward and reduces competitiveness. The lower competitiveness makes the market share of exports fall and the market share of imports rise, which reduces the positive effect on domestic production. Eventually, the effect on employment disappears and employment returns to its baseline. The long run effect on unemployment is also zero reflecting that the permanent increase in wages and prices deteriorates competitiveness and crowds out any impact on employment. This is the wage-driven crowding out process in ADAM.
The short run effect is closely related with the Keynesian income multiplier. The income multiplier refers to the final change in income as compared to the injection of capital deposits or investments which originally fueled the growth. It is usually used as a measurement of the effects of government spending on income. In the present experiment, the income multiplier can be seen as the ratio between the effects on final demand and the change in government purchase of goods and services. In a closed economy, the multiplier for domestic demand is larger than one because the exogenous increase in government purchase of goods and services creates additional domestic demand in the form of more private investment and larger private consumption. However, the ADAM multiplier for GDP remains less than one because higher demand triggers not only GDP but also imports, see ADAM book for further discussion.
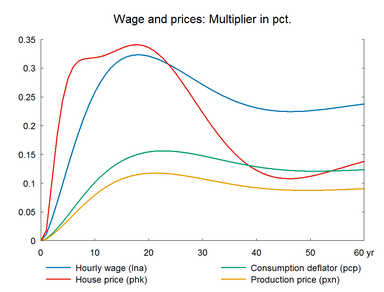
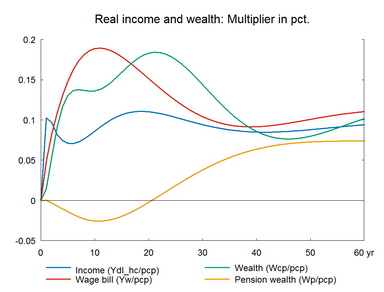
Wages and domestic prices increase in the medium and long run. But not equally. Prices adjust gradually to total production costs, which includes more than wages. Imported goods and services are for instance part of production costs. As the prices of imported goods are unchanged, prices increase less than wages. This results in a permanent positive effect on real wages, real income and private consumption. The long-term macro-consumption function in ADAM relates consumption to income and wealth and ensures that private consumption, real income and real wealth attain the same growth rate in the long run. Whenever real wages and real disposable income change permanently, private consumption changes, henceforth referred as a real wage effect.
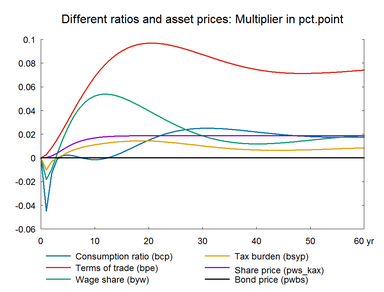
The real wage effect also translates into a long-run effect on the terms of trade. In the new equilibrium employment returns to its baseline while wages and prices increase permanently, which results in a permanent change in the long-run terms of trade.
The composition of GDP changes permanently towards higher public and private consumption and lower net exports relative to the baseline. That is, the composition of aggregate demand shifts from exports toward domestic consumption and investment and the composition of aggregate supply shifts from domestic production to imports.
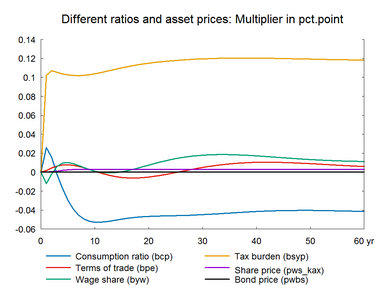
The experiment also creates a permanent change in the distribution of income. There is a permanent increase in the wage share defined as the share of value added which is payed out to workers. This is because wages have increased permanently higher than capital costs or more appropriately user costs. The effect on user costs is smaller because interest rates are fixed and investment prices change less than wages.
Figure 1a. The effect of a permanent increase in general government spending
|
||||||||||||||||||||||||||||||||||||||||||||||||||||||||||||||||||||||||||||||||||||||||||||||||||||||||||||||||||||||||||||||||||||||||||||||||||||||||||||||||||||||||||||||||||||||||||||||||||||||||||||||||||||||||||||||||||||||||||||||||||||||||||||||||||||||||||||||||||||||||||||||||||||||||||||||||||||||||||||||||||||
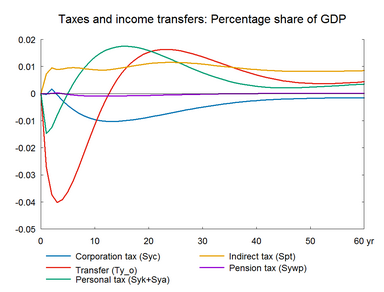
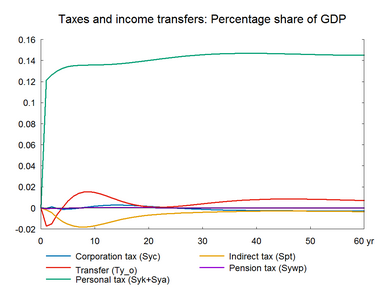
In the following, the public expenditure is financed by a corresponding increase in income tax rates. The public purchase of goods and services is increased by 0.1 percent of GDP, in 2010 prices. The central government income tax rates are permanently raised by 1.5 percent and the capital tax is temporarily raised by a lump sum of 0.5 percent of GDP in the first year only. (See experiment)
Table 1b. The effect of a permanent increase in public spending, balanced budget
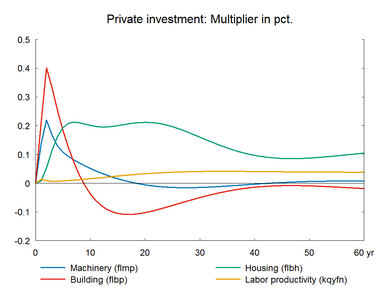
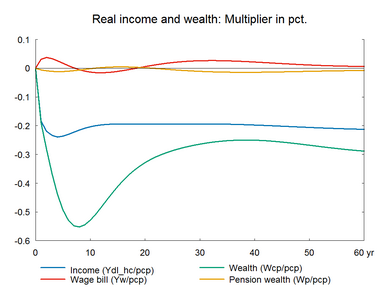
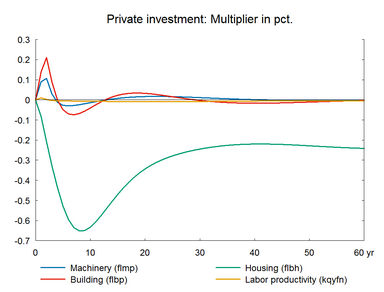
In contrast to the unfinanced experiment in section 1A, the long-term effect on government debt is now zero. There are two opposing effects - expansionary and contractionary effects. The former is due to the increase in public expenditures that increases domestic demand, production and employment. The contractionary effect is due to the increase in income tax rates which reduces disposable income and there by private consumption. In the very short term the expansionary effects are stronger so production and employment expand. Investments also expand reflecting the increase in business investments in machinery and buildings.
The overall positive effect in year 1 occurs because private consumption reacts to the tax increase with a delay. In the following year, the tax increase reduces consumption further as disposable income falls. As a result, employment falls. With a financed public purchase, it takes only 4 years for the improved budget to disappear and it takes almost the same number of years for employment to return to the baseline. The fall in private consumption reduces the demand for housing, and investment in housing and house prices fall. In the long run, private consumption and investment fall due to the permanent fall in disposable income. Investments also fall permanently due to the fall in residential investment.
The effect on unemployment oscillates before reaching equilibrium reflecting the fluctuation in the housing market and labor market. In general, with an unfinanced increase in public purchase it is exports that fall and make room for the public purchase of goods and services. With a tax-financed public purchase increase, it is the private domestic demand that falls to make room for the public purchase of goods and services. The public budget can be financed in various ways, and the outcome depends on the choice of financing instrument. For example, the outcome of the unfinanced shock in section 1A is equivalent to the outcome of an increase in public purchase financed by reduced public transfers to abroad. Public transfer vis-a-vis the foreign sector has no impact on the private sector in ADAM.
Figure 1b. The effect of a permanent increase in public spending, balanced budget
|
||||||||||||||||||||||||||||||||||||||||||||||||||||||||||||||||||||||||||||||||||||||||||||||||||||||||||||||||||||||||||||||||||||||||||||||||||||||||||||||||||||||||||||||||||||||||||||||||||||||||||||||||||||||||||||||||||||||||||||||||||||||||||||||||||||||||||||||||||||||||||||||||||||||||||||||||||||||||||||||||||||
