11. Labor supply - working hours

The supply of labor input will also increase if working hours increase. An increase in working hours raises employment in terms of hours and in the short run it reduces the number of workers employed. The following sections present a shock to working hours with and without balanced public budget.


hmtoggle_arrow1A. Working hours


Table 11a presents the effect of a permanent 1 percent increase in working hours. (See experiment)


Table 11a. The effect of a permanent increase in working hours

    1. yr 2. yr 3. yr 4. yr 5. yr 10. yr 15. yr 20. yr 25. yr 30. yr
    Million 2010-Dkr.
Priv. consumption fCp 848 1387 3121 3920 4192 2368 -384 -2037 -2569 -2326
Pub. consumption fCo -118 -179 -296 -390 -458 -563 -546 -561 -616 -691
Investment fI 482 1146 2230 3255 3968 4493 3418 3093 3472 4086
Export fE 636 1791 3161 4613 6177 14571 22153 27940 31710 33741
Import fM 505 966 2142 2901 3384 4287 4801 5817 6995 7996
GDP fY 1351 3123 5936 8254 10136 15656 18513 21035 23255 24960
    1000 Persons
Employment Q -26.44 -24.35 -21.37 -18.40 -15.67 -6.35 -1.78 0.99 2.48 2.76
Unemployment Ul 14.42 12.38 10.81 9.30 7.91 3.20 0.89 -0.52 -1.28 -1.41
    Percent of GDP
Pub. budget balance Tfn_o/Y -0.11 -0.09 -0.17 -0.05 0.05 0.29 0.37 0.44 0.51 0.57
Priv. saving surplus Tfn_hc/Y 0.09 0.05 0.08 -0.05 -0.14 -0.22 -0.09 0.00 0.03 0.04
Balance of payments Enl/Y -0.02 -0.04 -0.08 -0.10 -0.09 0.07 0.28 0.44 0.54 0.61
Foreign receivables Wnnb_e/Y 0.05 0.17 0.17 0.15 0.14 0.49 1.63 3.26 5.09 6.94
Bond debt Wbd_os_z/Y 0.10 0.19 0.33 0.36 0.31 -0.67 -2.03 -3.46 -4.95 -6.47
    Percent
Capital intensity fKn/fX -0.06 -0.15 -0.26 -0.34 -0.40 -0.49 -0.54 -0.61 -0.67 -0.68
Labour intensity hq/fX -0.02 -0.05 -0.08 -0.09 -0.10 -0.07 -0.04 -0.01 0.02 0.04
User cost uim -0.10 -0.24 -0.36 -0.47 -0.57 -0.91 -1.09 -1.16 -1.15 -1.10
Wage lna -0.25 -0.69 -1.07 -1.37 -1.63 -2.45 -2.78 -2.83 -2.70 -2.50
Consumption price pcp -0.09 -0.23 -0.36 -0.47 -0.57 -0.97 -1.22 -1.34 -1.37 -1.32
Terms of trade bpe -0.07 -0.17 -0.26 -0.34 -0.42 -0.68 -0.82 -0.87 -0.86 -0.81
    Percentage-point
Consumption ratio bcp -0.10 -0.07 -0.10 -0.01 0.06 0.08 -0.05 -0.15 -0.21 -0.23
Wage share byw -0.08 -0.21 -0.31 -0.38 -0.43 -0.50 -0.47 -0.41 -0.32 -0.25

(See details)


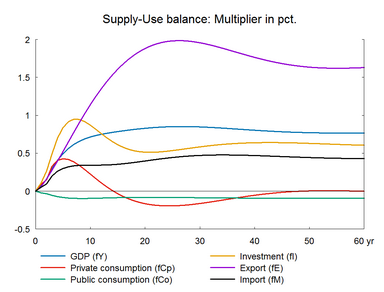
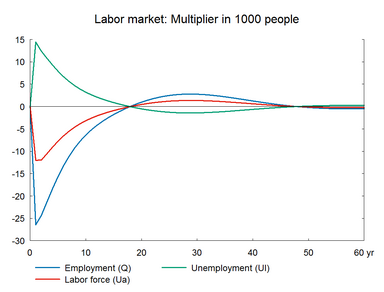
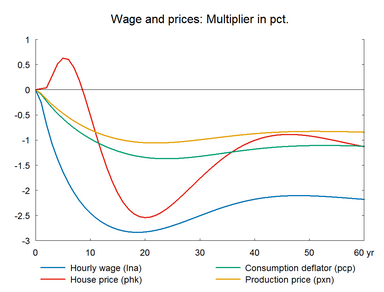
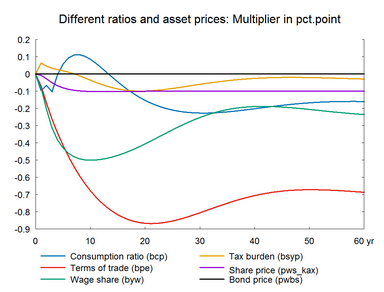
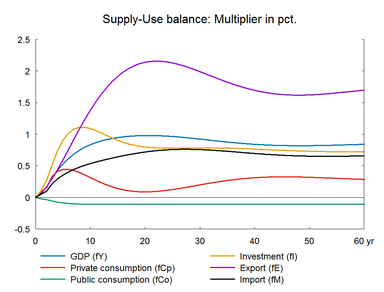
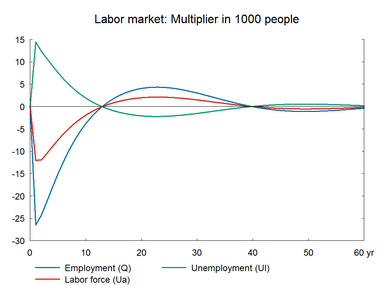
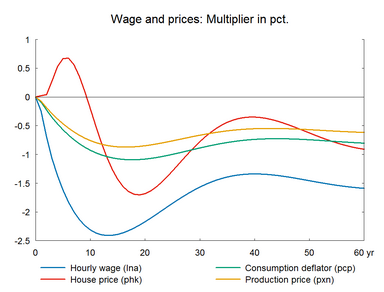
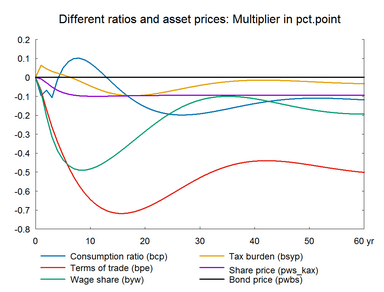
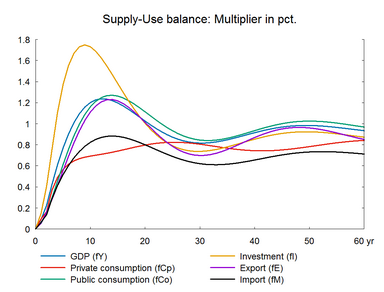
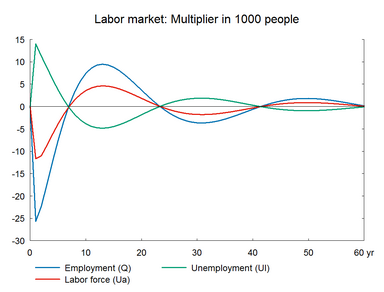
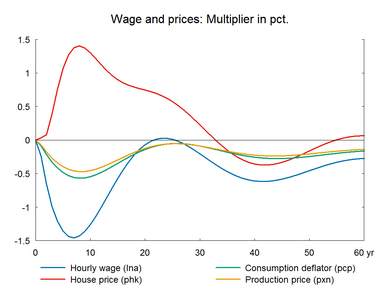
When working hours of existing workers increase potential production increases immediately. Compared to the previous experiment the initial reaction via the production function is stronger in the present experiment because the working hours of already employed people increases. In the short run, there is no change in demand, so layoffs are inevitable and employment falls. The rise in unemployment dampens wages and competitiveness improves. Consequently, the wage-driven crowding out returns unemployment to the baseline in the long run. The wage relation in ADAM is a Phillips curve, which links the changes in wages to unemployment. A fall/rise in unemployment pushes wages and hence prices upward/downward and reduces/improves competitiveness. So exports and production decrease/increase and over time unemployment returns to its baseline. This is the wage-driven crowding out process.


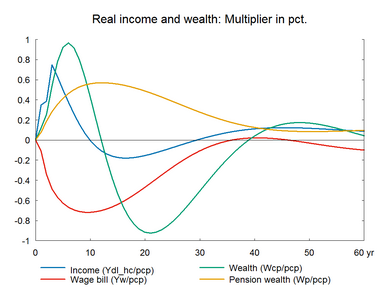
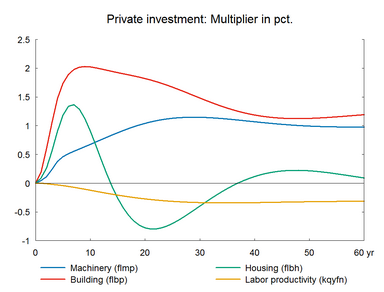
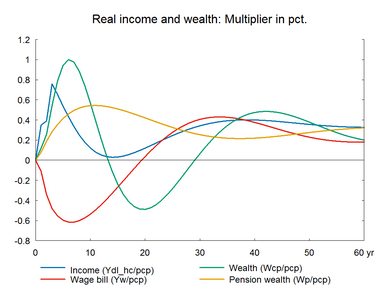
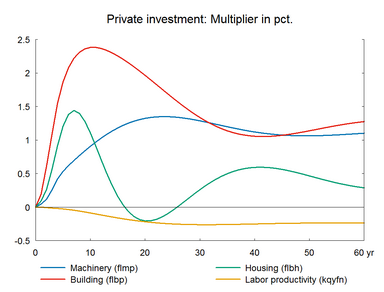
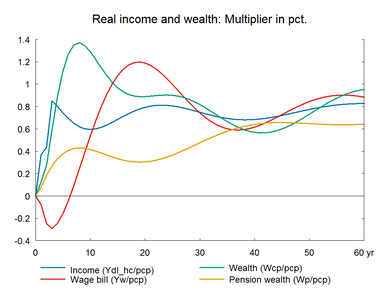
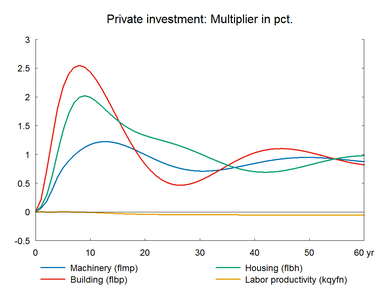
The previous section 10 showed that private consumption falls in the long term when the positive shock to labor input is in number of workers. When working hours increase, there is no fall in private consumption in the long run. Public transfer income is adjusted with the income per worker. Thus, the fall in total real income is smaller than in the previous experiment because the real income of public transfer earners is adjusted upwards with the number of working hours per employed. Transfer income is not adjusted with the number of employed. In this way, the different impact on consumption in experiment 10 and 11 reflects the institutional setup. The marginal increase in disposable income is not enough to raise private consumption in the long run as there is also a fall in real wealth due to a fall in housing wealth. The higher investment raises imports in the long run.


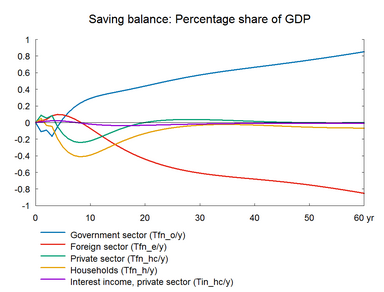
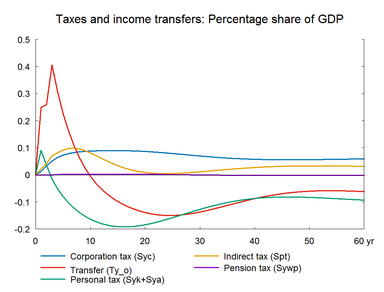
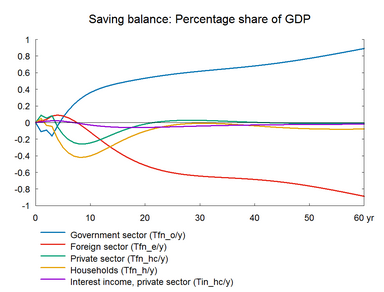
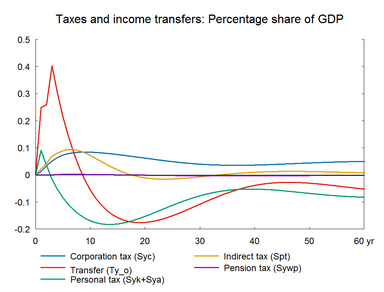
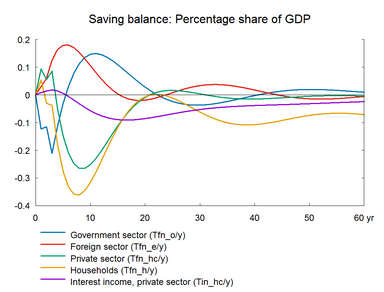
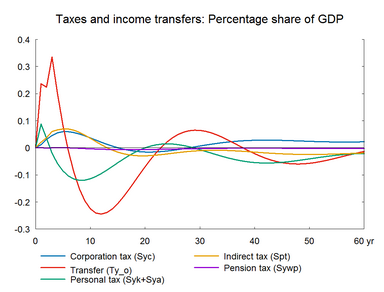
There is a positive effect on the public budget in the long run, because the fall in public expenses is larger than the fall in revenues. Personal income taxes do not fall as much as annual incomes, as the higher working hours offset the fall in annual incomes. Corporate taxes also increase due to the increase in profits. Indirect taxes also contribute to revenue. However, the positive long term effect on the public budget is smaller than in experiment 10 due to the indexation of public transfers.


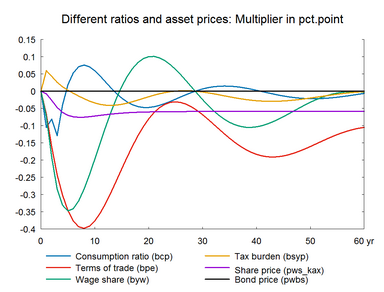
Figure 11a. The effect of a permanent increase in working hours


fig_11_1a_zoom38fig_11_2a_zoom38


fig_11_3a_zoom38fig_11_4a_zoom38


fig_11_5a_zoom38fig_11_6a_zoom38


fig_11_7a_zoom38fig_11_8a_zoom38

hmtoggle_arrow1B. Working hours - including supply effects on exports


A permanent increase in working hours has a permanent positive effect on domestic output; and it is likely that the market shares of danish exporter will rise. Table 10x presents the effect of a permanent increase in labor supply accompanied by supply effects in foreign trade. In contrast to section A, export performance are improved by an elasticity of 0.7 relative to GVA (gross value added).(See experiment)


Table 11b. The effect of a permanent increase in working hours, with supply effects

    1. yr 2. yr 3. yr 4. yr 5. yr 10. yr 15. yr 20. yr 25. yr 30. yr
    Million 2010-Dkr.
Priv. consumption fCp 848 1391 3147 3996 4352 3321 1608 1075 1653 2830
Pub. consumption fCo -118 -180 -299 -398 -473 -636 -671 -716 -785 -863
Investment fI 482 1169 2311 3442 4296 5634 5047 4803 5064 5490
Export fE 636 1857 3383 5114 7049 17640 26399 31774 34060 34329
Import fM 505 1006 2291 3249 4006 6705 8708 10525 11956 12865
GDP fY 1351 3171 6110 8655 10848 18306 22340 24863 26386 27223
    1000 Persons
Employment Q -26.44 -24.31 -21.23 -18.07 -15.05 -3.80 1.80 4.05 4.19 3.02
Unemployment Ul 14.42 12.36 10.74 9.12 7.58 1.88 -0.95 -2.08 -2.14 -1.53
    Percent of GDP
Pub. budget balance Tfn_o/Y -0.11 -0.09 -0.16 -0.04 0.06 0.36 0.47 0.53 0.58 0.62
Priv. saving surplus Tfn_hc/Y 0.09 0.05 0.08 -0.05 -0.14 -0.25 -0.12 -0.02 0.02 0.03
Balance of payments Enl/Y -0.02 -0.04 -0.08 -0.09 -0.08 0.12 0.35 0.52 0.60 0.64
Foreign receivables Wnnb_e/Y 0.05 0.16 0.17 0.14 0.12 0.45 1.68 3.50 5.50 7.47
Bond debt Wbd_os_z/Y 0.10 0.19 0.32 0.35 0.28 -0.92 -2.63 -4.38 -6.05 -7.63
    Percent
Capital intensity fKn/fX -0.06 -0.15 -0.27 -0.36 -0.43 -0.57 -0.60 -0.60 -0.57 -0.51
Labour intensity hq/fX -0.02 -0.05 -0.08 -0.10 -0.11 -0.10 -0.07 -0.04 -0.01 0.01
User cost uim -0.10 -0.24 -0.36 -0.47 -0.56 -0.87 -0.98 -0.96 -0.87 -0.78
Wage lna -0.25 -0.69 -1.07 -1.37 -1.62 -2.31 -2.39 -2.17 -1.85 -1.57
Consumption price pcp -0.09 -0.23 -0.36 -0.47 -0.57 -0.93 -1.08 -1.08 -1.00 -0.89
Terms of trade bpe -0.07 -0.17 -0.26 -0.34 -0.41 -0.65 -0.72 -0.69 -0.62 -0.53
    Percentage-point
Consumption ratio bcp -0.10 -0.07 -0.11 -0.01 0.05 0.07 -0.06 -0.16 -0.20 -0.19
Wage share byw -0.08 -0.21 -0.31 -0.39 -0.43 -0.48 -0.40 -0.28 -0.18 -0.12

(See details)


Figure 11b. The effect of a permanent increase in working hours, with supply effects


fig_11_1b_zoom38fig_11_2b_zoom38


fig_11_3b_zoom38fig_11_4b_zoom38


fig_11_5b_zoom38fig_11_6b_zoom38


fig_11_7b_zoom38fig_11_8b_zoom38

hmtoggle_arrow1C. Working hours - balanced budget


In the present case, the supply effect on exports ensures a balanced public budget leaving almost no room for income tax induced balancing in the public budget.(See experiment)


Table 11c. The effect of a permanent increase in working hours, balanced budget

    1. yr 2. yr 3. yr 4. yr 5. yr 10. yr 15. yr 20. yr 25. yr 30. yr
    Million 2010-Dkr.
Priv. consumption fCp 891 1535 3527 4733 5535 7321 8433 9785 10890 11472
Pub. consumption fCo 274 803 1571 2437 3324 6826 8004 7602 6870 6701
Investment fI 665 1757 3438 5152 6492 8944 7716 6044 5136 5161
Export fE 614 1790 3230 4820 6537 14194 16766 15042 12566 12041
Import fM 630 1394 3104 4578 5847 10306 11935 11705 10873 10544
GDP fY 1819 4439 8546 12366 15754 26337 28223 26019 23862 24063
    1000 Persons
Employment Q -25.66 -22.30 -17.44 -12.41 -7.66 7.42 8.79 3.68 -1.47 -3.63
Unemployment Ul 13.99 11.29 8.74 6.16 3.75 -3.85 -4.47 -1.84 0.78 1.86
    Percent of GDP
Pub. budget balance Tfn_o/Y -0.12 -0.12 -0.21 -0.11 -0.03 0.15 0.11 0.03 -0.02 -0.04
Priv. saving surplus Tfn_hc/Y 0.09 0.06 0.09 -0.05 -0.15 -0.25 -0.11 -0.01 0.02 0.00
Balance of payments Enl/Y -0.03 -0.06 -0.13 -0.16 -0.18 -0.11 0.00 0.02 -0.01 -0.03
Foreign receivables Wnnb_e/Y 0.02 0.06 -0.08 -0.29 -0.53 -1.60 -1.89 -1.66 -1.34 -1.14
Bond debt Wbd_os_z/Y 0.10 0.21 0.37 0.45 0.45 -0.10 -0.65 -0.79 -0.64 -0.41
    Percent
Capital intensity fKn/fX -0.08 -0.19 -0.35 -0.47 -0.56 -0.60 -0.33 -0.07 0.07 0.08
Labour intensity hq/fX -0.02 -0.03 -0.05 -0.06 -0.05 0.03 0.09 0.10 0.09 0.07
User cost uim -0.09 -0.22 -0.33 -0.40 -0.45 -0.45 -0.23 -0.05 0.01 -0.05
Wage lna -0.24 -0.66 -0.99 -1.21 -1.35 -1.26 -0.57 -0.07 0.01 -0.20
Consumption price pcp -0.09 -0.22 -0.33 -0.42 -0.48 -0.55 -0.35 -0.14 -0.05 -0.09
Terms of trade bpe -0.07 -0.16 -0.24 -0.30 -0.35 -0.38 -0.23 -0.08 -0.03 -0.07
    Percentage-point
Consumption ratio bcp -0.11 -0.08 -0.13 -0.04 0.02 0.06 -0.02 -0.05 -0.02 0.01
Wage share byw -0.07 -0.19 -0.28 -0.33 -0.35 -0.20 0.01 0.10 0.06 -0.02

(See details)


Figure 11c. The effect of a permanent increase in working hours, balanced budget


fig_11_1c_zoom38fig_11_2c_zoom38


fig_11_3c_zoom38fig_11_4c_zoom38


fig_11_5c_zoom38fig_11_6c_zoom38


fig_11_7c_zoom38fig_11_8c_zoom38