Income tax rates can be reduced to stimulate economic activity. The expansionary effects arise through the effect on disposable income.
Income tax rates for all income categories are permanently reduced by 1.5 percent. The shock corresponds to an immediate loss in tax revenue of 0.1 percent of GDP in 2010 prices, which corresponds to 0.15 percent of disposable income in the private sector. (See experiment)
Table 6. The effect of a permanent fall in income tax rates
| 1. yr | 2. yr | 3. yr | 4. yr | 5. yr | 10. yr | 15. yr | 20. yr | 25. yr | 30. yr | ||
| Million 2010-Dkr. | |||||||||||
| Priv. consumption | fCp | 1068 | 1842 | 2391 | 2786 | 3080 | 3846 | 4396 | 4930 | 5358 | 5678 |
| Pub. consumption | fCo | -45 | -90 | -125 | -152 | -170 | -196 | -193 | -198 | -209 | -223 |
| Investment | fI | 356 | 799 | 1151 | 1399 | 1556 | 1450 | 1015 | 811 | 757 | 748 |
| Export | fE | -26 | -76 | -161 | -277 | -425 | -1535 | -2807 | -3725 | -4147 | -4188 |
| Import | fM | 557 | 978 | 1253 | 1428 | 1528 | 1411 | 1071 | 873 | 804 | 825 |
| GDP | fY | 841 | 1567 | 2092 | 2437 | 2637 | 2353 | 1601 | 1251 | 1285 | 1533 |
| 1000 Persons | |||||||||||
| Employment | Q | 0.54 | 1.19 | 1.75 | 2.15 | 2.40 | 1.86 | 0.44 | -0.45 | -0.72 | -0.62 |
| Unemployment | Ul | -0.29 | -0.63 | -0.91 | -1.11 | -1.23 | -0.94 | -0.22 | 0.23 | 0.37 | 0.32 |
| Percent of GDP | |||||||||||
| Pub. budget balance | Tfn_o/Y | -0.11 | -0.09 | -0.06 | -0.05 | -0.04 | -0.07 | -0.12 | -0.16 | -0.19 | -0.20 |
| Priv. saving surplus | Tfn_hc/Y | 0.08 | 0.03 | -0.01 | -0.03 | -0.05 | -0.05 | -0.03 | -0.02 | -0.02 | -0.02 |
| Balance of payments | Enl/Y | -0.03 | -0.05 | -0.07 | -0.08 | -0.09 | -0.12 | -0.15 | -0.18 | -0.21 | -0.22 |
| Foreign receivables | Wnnb_e/Y | -0.06 | -0.17 | -0.29 | -0.42 | -0.55 | -1.15 | -1.69 | -2.22 | -2.78 | -3.33 |
| Bond debt | Wbd_os_z/Y | 0.09 | 0.16 | 0.20 | 0.24 | 0.27 | 0.46 | 0.83 | 1.33 | 1.87 | 2.40 |
| Percent | |||||||||||
| Capital intensity | fKn/fX | -0.03 | -0.05 | -0.05 | -0.05 | -0.04 | 0.08 | 0.17 | 0.21 | 0.21 | 0.21 |
| Labour intensity | hq/fX | -0.01 | -0.02 | -0.02 | -0.02 | -0.02 | 0.00 | -0.01 | -0.01 | -0.02 | -0.02 |
| User cost | uim | 0.00 | 0.00 | 0.01 | 0.02 | 0.03 | 0.10 | 0.14 | 0.15 | 0.14 | 0.12 |
| Wage | lna | 0.01 | 0.02 | 0.04 | 0.08 | 0.11 | 0.30 | 0.39 | 0.39 | 0.34 | 0.29 |
| Consumption price | pcp | 0.00 | 0.01 | 0.02 | 0.03 | 0.04 | 0.12 | 0.18 | 0.20 | 0.20 | 0.18 |
| Terms of trade | bpe | 0.00 | 0.00 | 0.01 | 0.02 | 0.03 | 0.08 | 0.11 | 0.12 | 0.11 | 0.10 |
| Percentage-point | |||||||||||
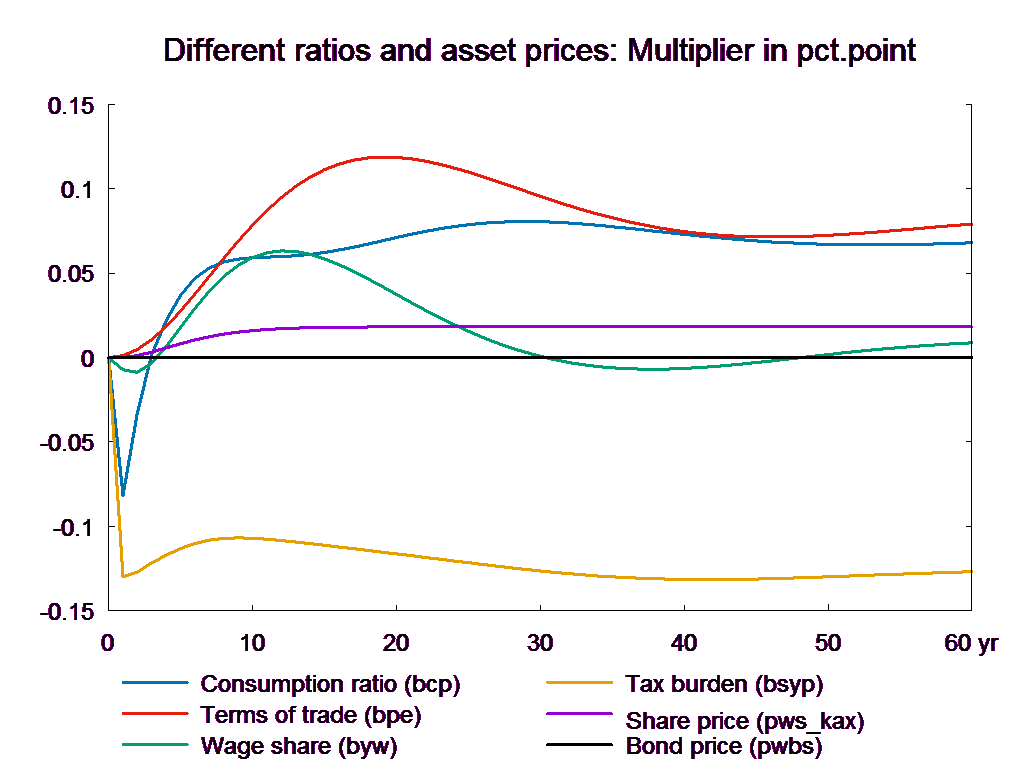
| Consumption ratio | bcp | -0.08 | -0.03 | 0.00 | 0.02 | 0.04 | 0.06 | 0.06 | 0.07 | 0.08 | 0.08 |
| Wage share | byw | -0.01 | -0.01 | 0.00 | 0.01 | 0.02 | 0.06 | 0.06 | 0.04 | 0.02 | 0.00 |
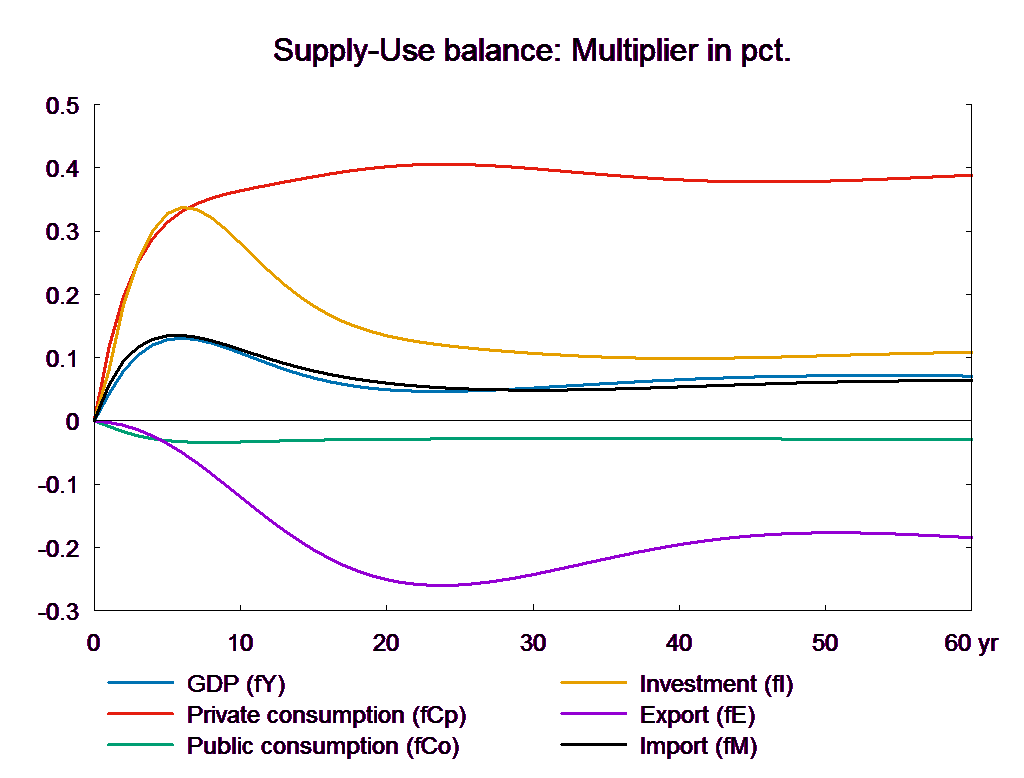
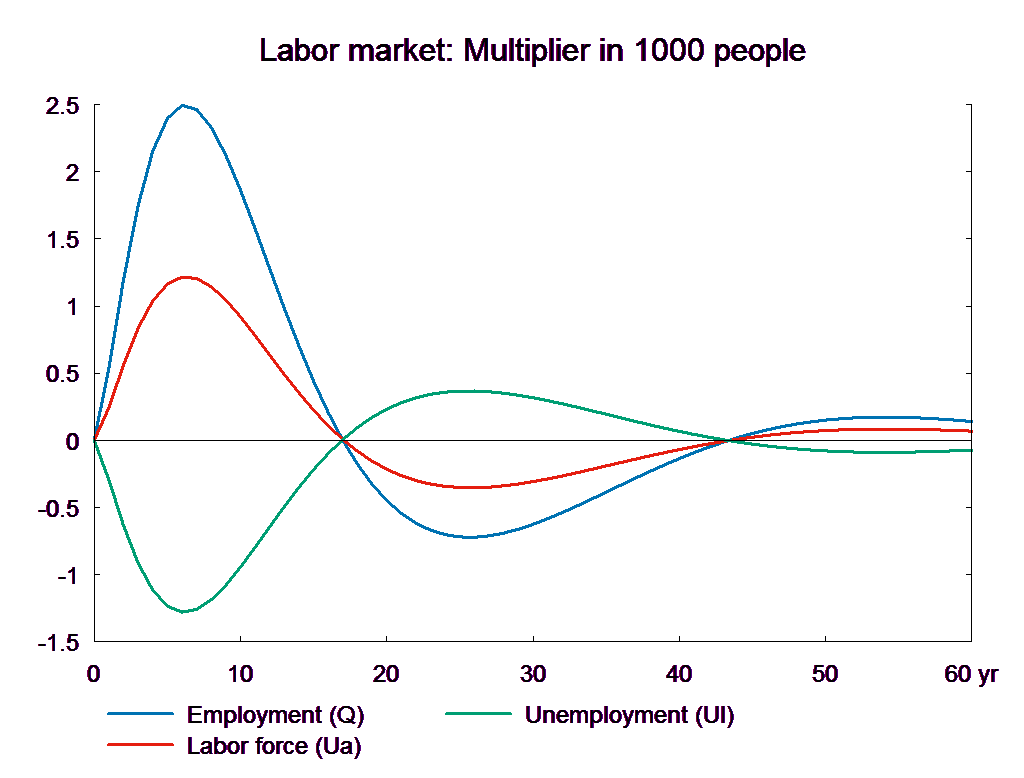
The immediate effect of a fall in income taxes is a fall in public revenues and (real) disposable income increases relative to the baseline, which raises private consumption. Domestic demand booms and production and employment increase. The employment effect in the first few years is slower than in the previous experiments. This is because the short-run income elasticity of consumption is lower than 1, so the change in income taxes does not affect demand as directly as a change in government purchases. The effect after a few years is more comparable to the public purchase experiment. In the medium to long term, the wage-driven crowding out returns unemployment to its baseline.▼ The wage relation in ADAM is a Phillips curve, which links the changes in wages to unemployment. A fall/rise in unemployment pushes wages and hence prices upward/downward and reduces/improves competitiveness. So exports and production decrease/increase and over time unemployment returns to its baseline. This is the wage-driven crowding out process.
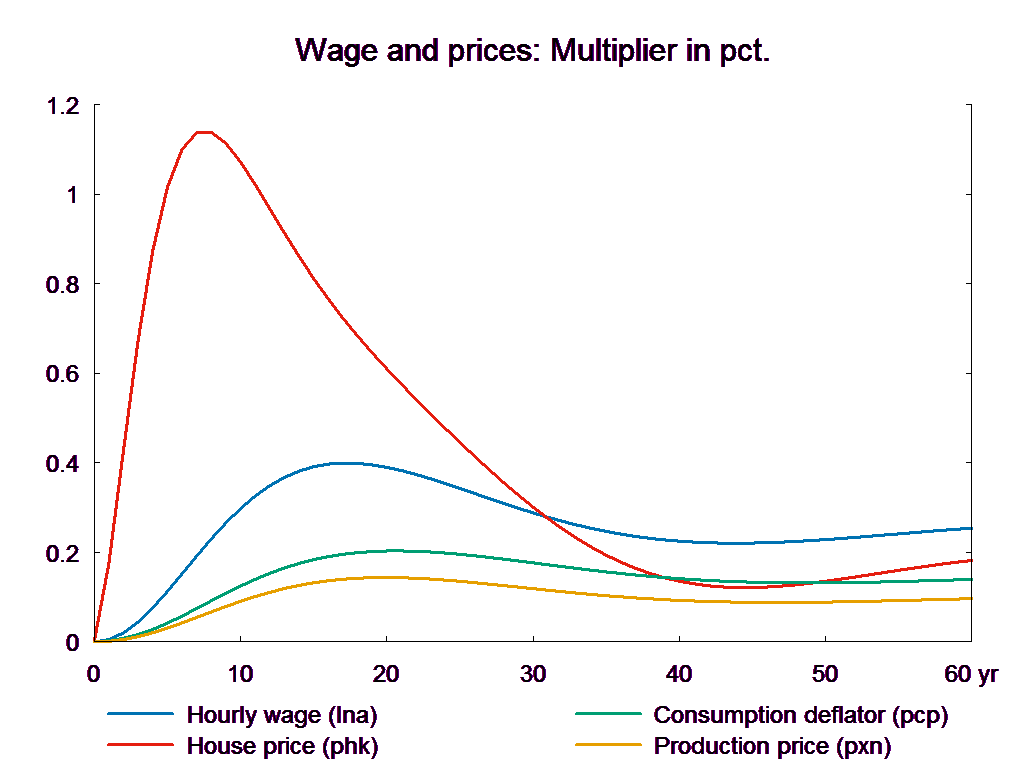
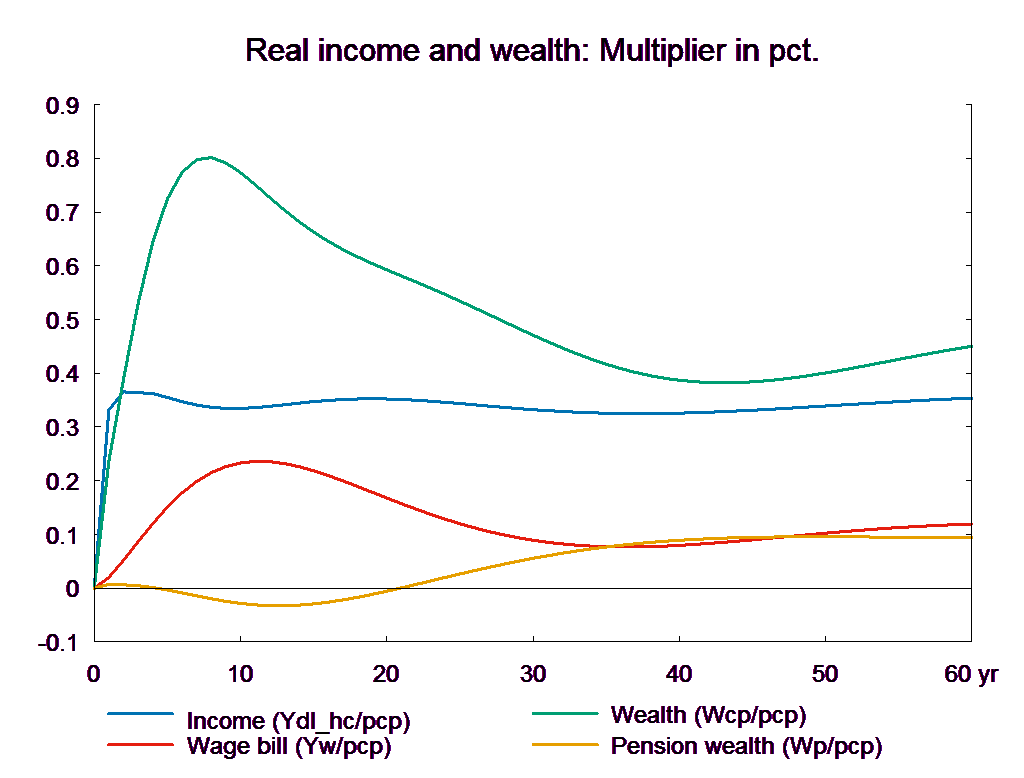
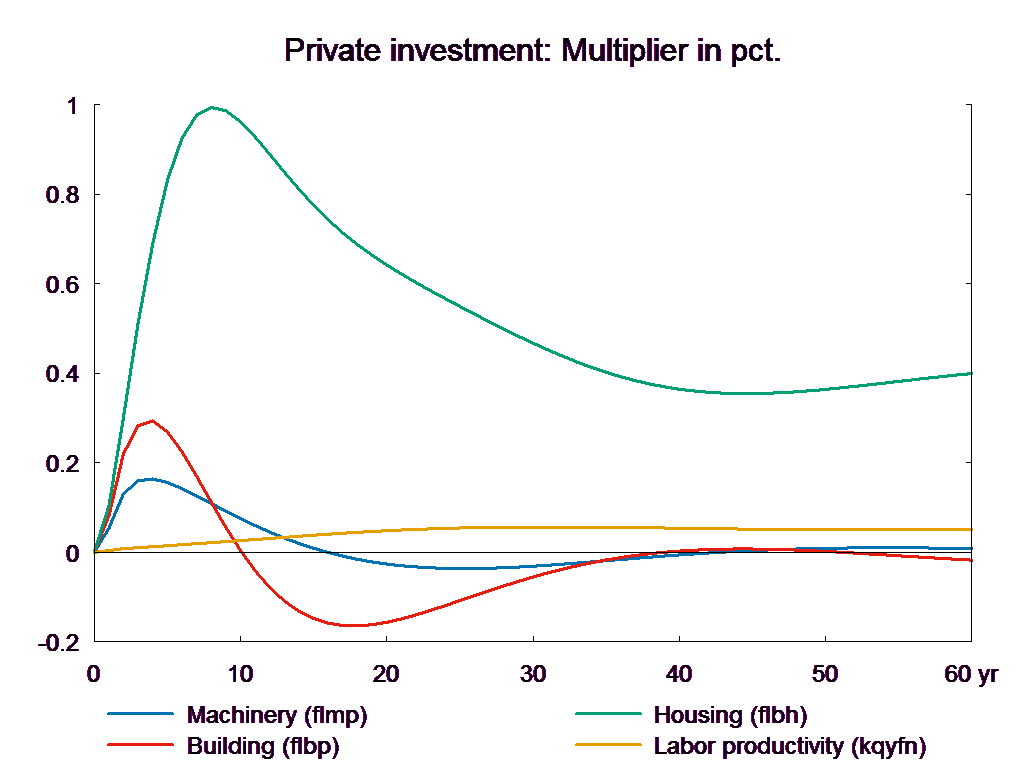
Compared to the previous demand shocks, the effect on private consumption is larger. Because the shock directly affects disposable income and hence private consumption. The higher private consumption raises investment in housing and house prices and the impact on housing is strong as the initial impact on consumption is strong. This in turn raises housing wealth, which stimulates private consumption for a longer period. The demand for dwelling increases as the income effect increases. But it takes time to expand the stock of housing. Consequently, the house price of existing houses will remain high for a longer period.
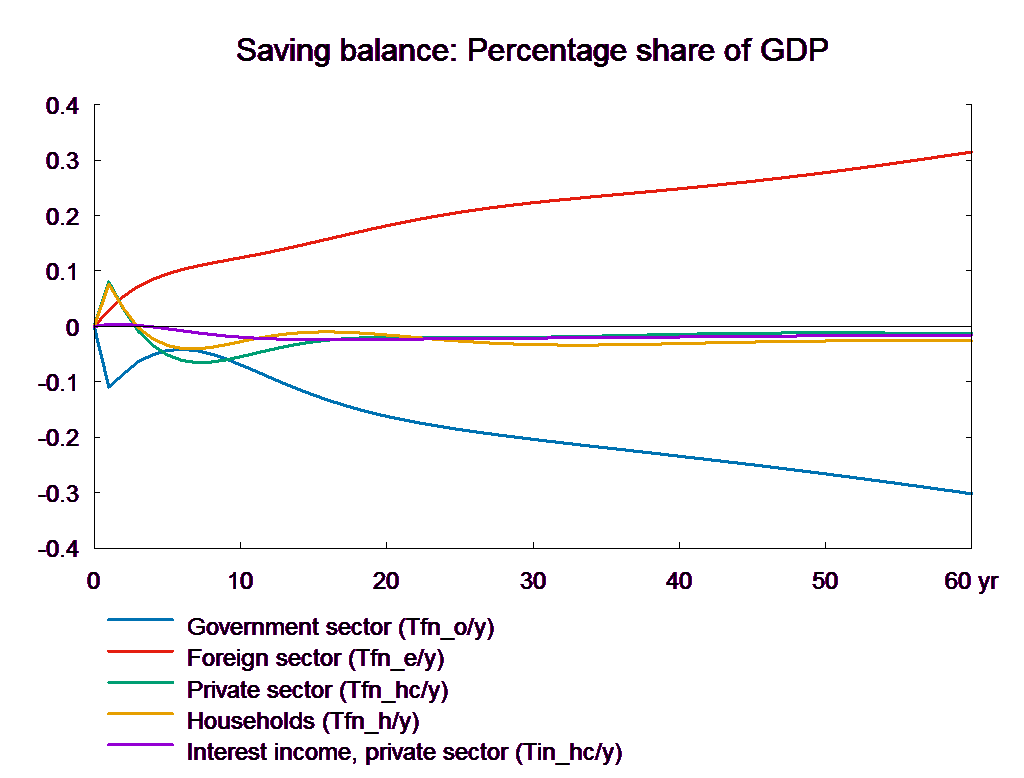
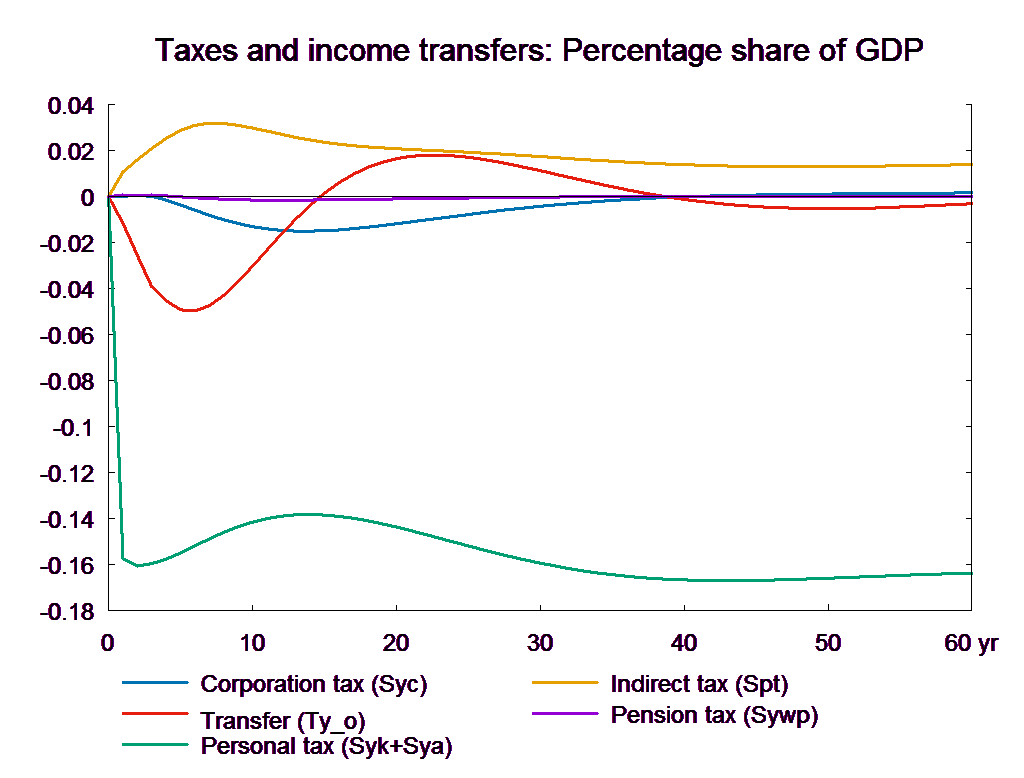
As in the other fiscal experiments, the short-run effect on the public budget is moderated by the short-run reaction in the economy, i.e. the short-run fall in unemployment and unemployment benefits. In the long run, the lower tax income results in a permanent deterioration of the public budget and the balance of payments.
It may be noted that there is a positive composition effect on GDP. This effect is caused by the increase in private consumption as higher private consumption increases the content of indirect taxes in GDP.▼ The composition effect accounts for about 40 percent of the long-term effect on GDP reported in the table. However, the effect does not add to the real size of the economy. Total production and total employment are not changed in the long run.
Note also that the positive effect on labor supply of a tax reduction is not considered in the present experiment. There is no link between labor supply and income taxes in ADAM. But one can choose to raise labor supply when reducing income tax rates. An accompanying increase in labor supply would have a positive effect on production and government finances, see the supply side shocks below.
Figure 6. The effect of a permanent fall in income tax rates