
Consumer price index
What is the current inflation rate and how are different population groups affected? The consumer price index follows the evolution of consumer prices for typical goods and services. The annual change in the consumer price index is used as a measure of inflation and is a key economic figure.
Explainer on…
The price paid by the consumer, i.e. including VAT and taxes and after deduction of any subsidies.
The general increase over time in prices of goods and services included in private household consumption, serving as an indicator of declining purchasing power. In Denmark, inflation is measured using the consumer price index.
Indicator of the underlying trend in consumer prices, where items with significant price fluctuations are excluded from the calculation. This provides a more accurate picture of the growth in production costs and the relationship between supply and demand. The consumer price index excluding energy and unprocessed food is used to measure core inflation.
Selected statistics on Consumer price index
Calculating percentage change?
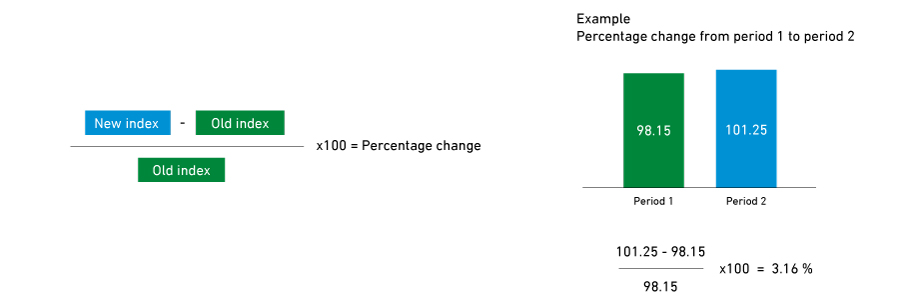
Calculating percentage change from year to year (instead of month to month)? Use table PRIS02
Inflation
The consumer price index is calculated on the basis of 23,000 prices collected from approx. 1,600 shops, companies and institutions throughout Denmark. The prices are collected by questionnaires or by means of price collectors who visit the individual shops. Prices on food and beverages and household articles are to a large extent covered by the use of scanner data from supermarket chains. Prices are also obtained via the internet. Most prices are by far collected monthly. For goods and services, where prices typically change less frequently, prices are collected more rarely, for instance quarterly or biannually. The index weights for the detailed indices (elementary aggregate indices) are calculated on the basis of data from the national accounts on final consumption expenditure of households in Denmark, supplemented by detailed information from the Household Budget Survey.
Core inflation
The consumer price index is calculated on the basis of 23,000 prices collected from approx. 1,600 shops, companies and institutions throughout Denmark. The prices are collected by questionnaires or by means of price collectors who visit the individual shops. Prices on food and beverages and household articles are to a large extent covered by the use of scanner data from supermarket chains. Prices are also obtained via the internet. Most prices are by far collected monthly. For goods and services, where prices typically change less frequently, prices are collected more rarely, for instance quarterly or biannually. The index weights for the detailed indices (elementary aggregate indices) are calculated on the basis of data from the national accounts on final consumption expenditure of households in Denmark, supplemented by detailed information from the Household Budget Survey.
How are different groups affected by inflation?

The consumer price index is calculated on the basis of 23,000 prices collected from approx. 1,600 shops, companies and institutions throughout Denmark. The prices are collected by questionnaires or by means of price collectors who visit the individual shops. Prices on food and beverages and household articles are to a large extent covered by the use of scanner data from supermarket chains. Prices are also obtained via the internet. Most prices are by far collected monthly. For goods and services, where prices typically change less frequently, prices are collected more rarely, for instance quarterly or biannually. The index weights for the detailed indices (elementary aggregate indices) are calculated on the basis of data from the national accounts on final consumption expenditure of households in Denmark, supplemented by detailed information from the Household Budget Survey.

On the statistics – documentation, sources and method
See the documentation of statistics to learn more:
The purpose of the consumer price index is to measure the development of the prices charged to consumers for goods and services bought by private households in Denmark. The consumer price index has been calculated since 1914, but there are estimated figures for the development in consumer prices back to 1872. From January 1967 the index has been calculated on a monthly basis.
Additional documentation
The statistics measure the development in rent (housing). The survey has been carried out since the 1950s.